
Compare and discover, directly in Atomic
Compare filter sets on the Insights dashboard: this week vs last, iOS vs Android, card vs card. Side-by-side, no exports required.

Jake Dale
—
Teams usually ask the same question about their messages and campaigns: is this actually working, and is it working-well? Finding an answer means doing manual comparison: this week against last week, iOS against Android, one campaign against another.
Until now, in Atomic, that meant applying a set of filters in the insights dashboard, opening a new tab to apply another set of filters, and then manually comparing across browser windows. This was cumbersome, easy to get wrong, and difficult to eyeball.
Now you can compare in place
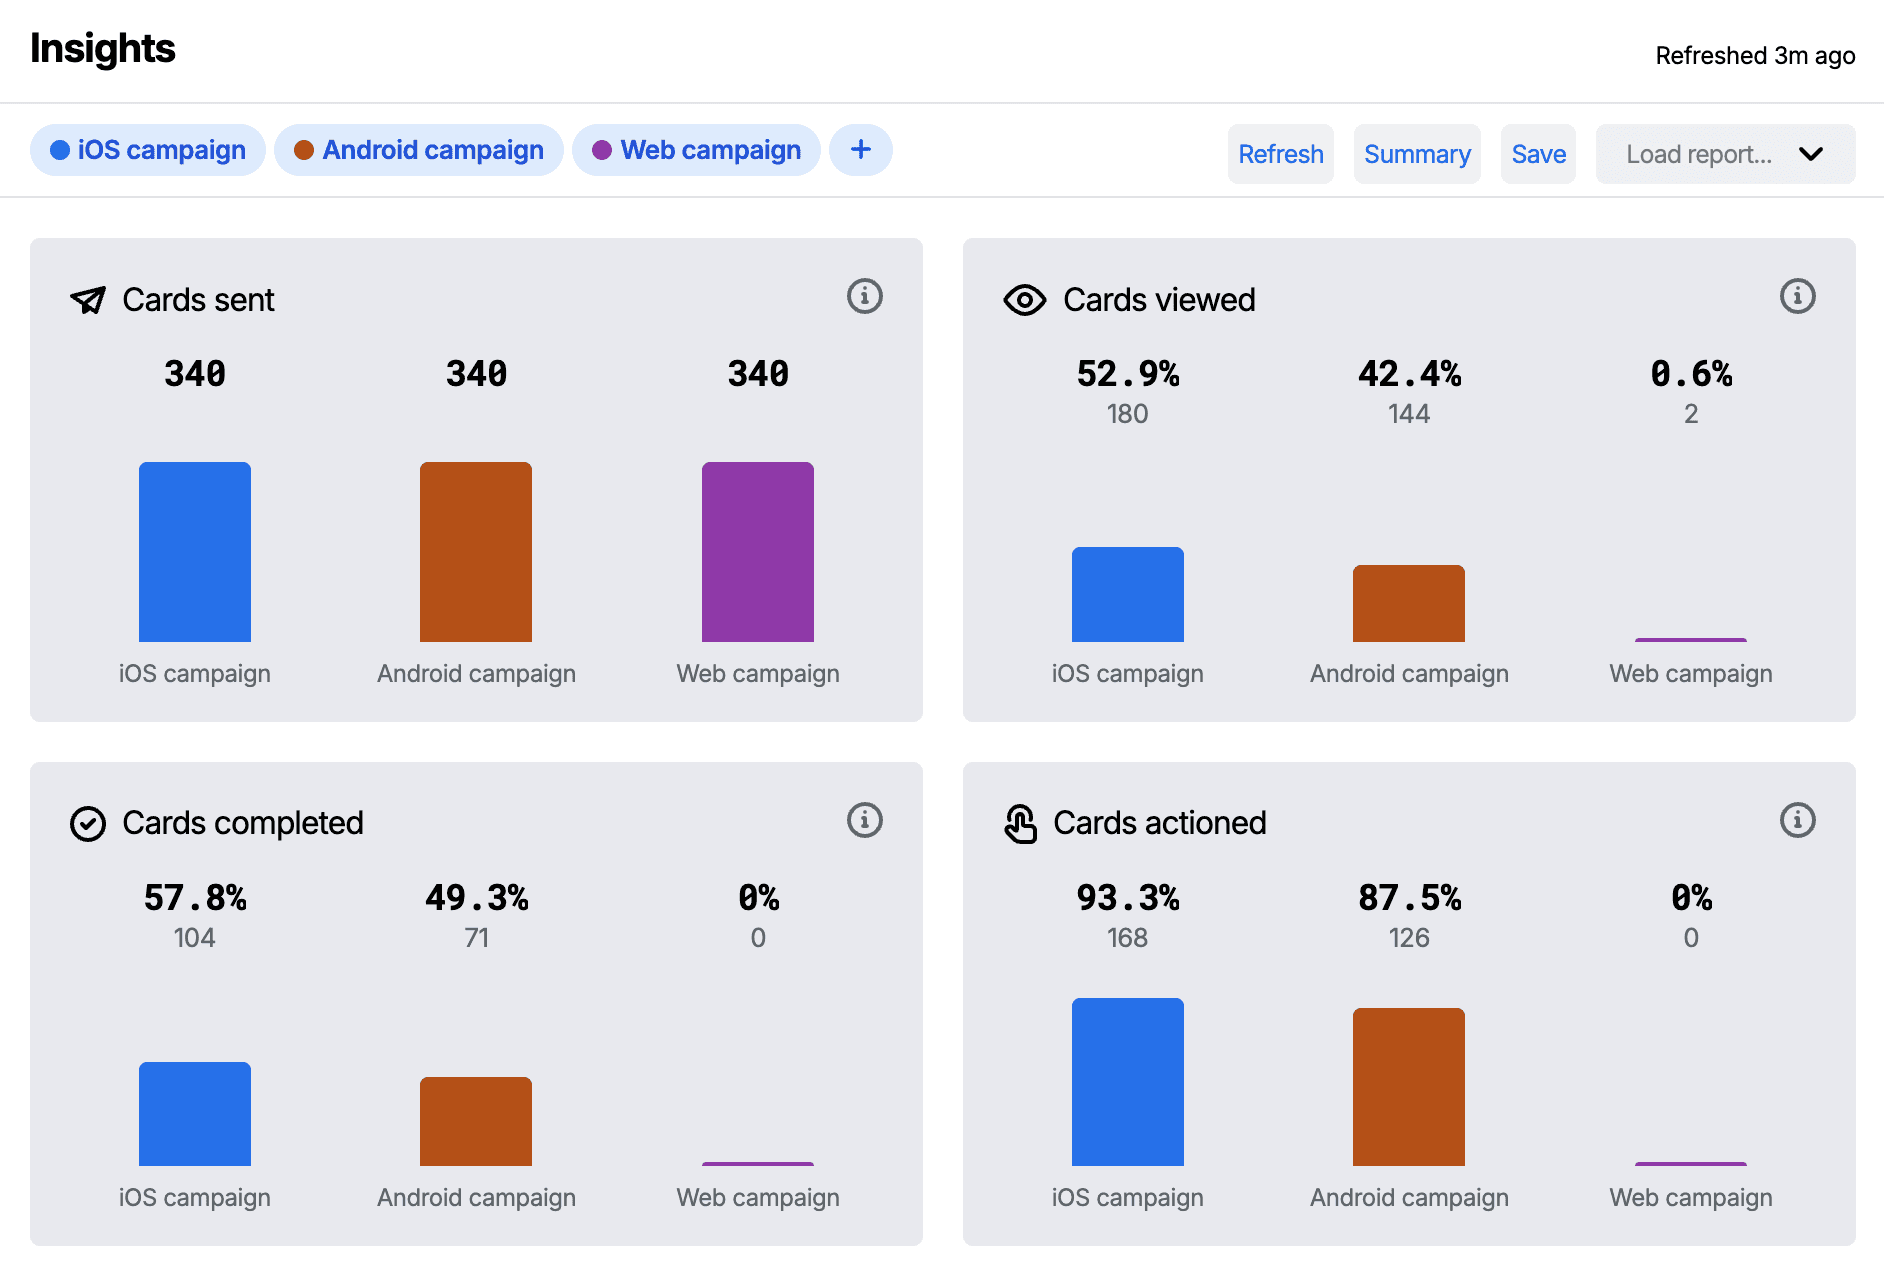
The Atomic Insights dashboard now lets you build several filter sets and see them together. Every insight shows one colored bar per set, so the difference reads at a glance. Just one browser tab and no having to re-run the same view with slightly different criteria multiple times. You set up the comparison once and the whole dashboard answers the question at the same time.
How it works
Open the filters from the bar at the top of the dashboard and click the + to add a filter set.
You can add an Empty filter set and build filters from scratch, or optionally start from a set of presets:
Give each set a Title and a color so it's easy to visually track across the dashboard.
Once multiple filter sets are applied the dashboard changes to reflect this:
Tiles that normally show a count now show each set's total, tiles that normally show a percentage now show the rate with the underlying count beneath.
When you download the dashboard Summary, all sets come down in a single CSV with a Filter set column.
As with single filter sets, you can save the whole comparison as a report to return to or share later.
Full details are in the Insights documentation.
Imagine...
A retail bank rolling out a new in-app message wants to know if engagement is climbing. They add a Week before set and watch read rates move week over week, right on the dashboard.
A telco suspects Android users interact differently than iOS. One click on Split by platform and every tile breaks down by iOS, Android, and Web.
An insurer is testing two onboarding Action Flows. They put both in a comparison and see which drives more completed actions, without exporting a thing.
Why Atomic
Many engagement and in-app messaging platforms make you leave the product to compare anything, export to a spreadsheet, or pipe events into a BI tool and wait on an analyst.
Atomic keeps the comparison where you already work. Product, CX, and marketing teams get side-by-side answers themselves, in seconds. So "is it working?" stops being a data request and becomes something you just look at.
Open Insights, click the + in the filters, and build your first comparison today.
About the author
Jake Dale
Head of Engineering
Jake leads the engineering teams at Atomic. When he’s not architecting, coaching and engineering, Jake is supporting and working with our customers to make the most of in-app messaging through Atomic.



